Screenshots
Explore the Radegast EDR Console interface through detailed screenshots.
// interface tour
Screenshots
Get a detailed look at the Radegast EDR Console interface. Click on any screenshot to view it in full size.
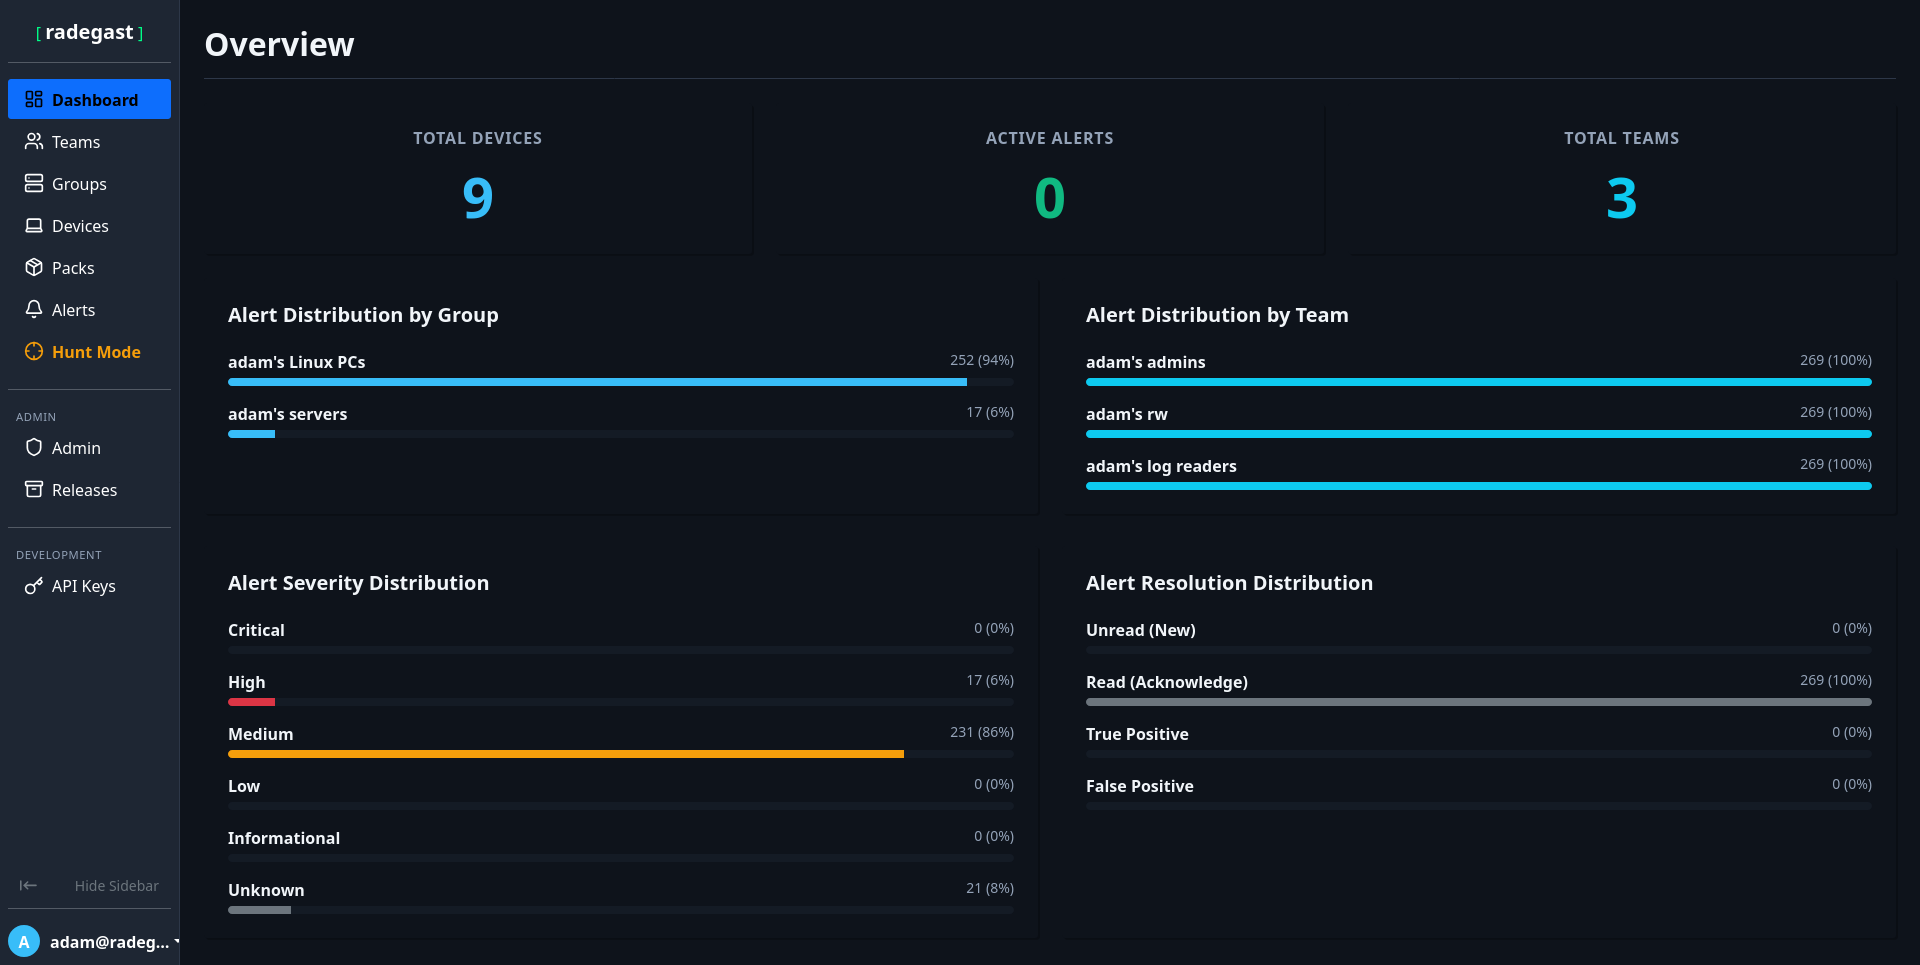
Dashboard
Dashboard provides a quick overview of current device stats and also alerts that were not yet seen or resolved.
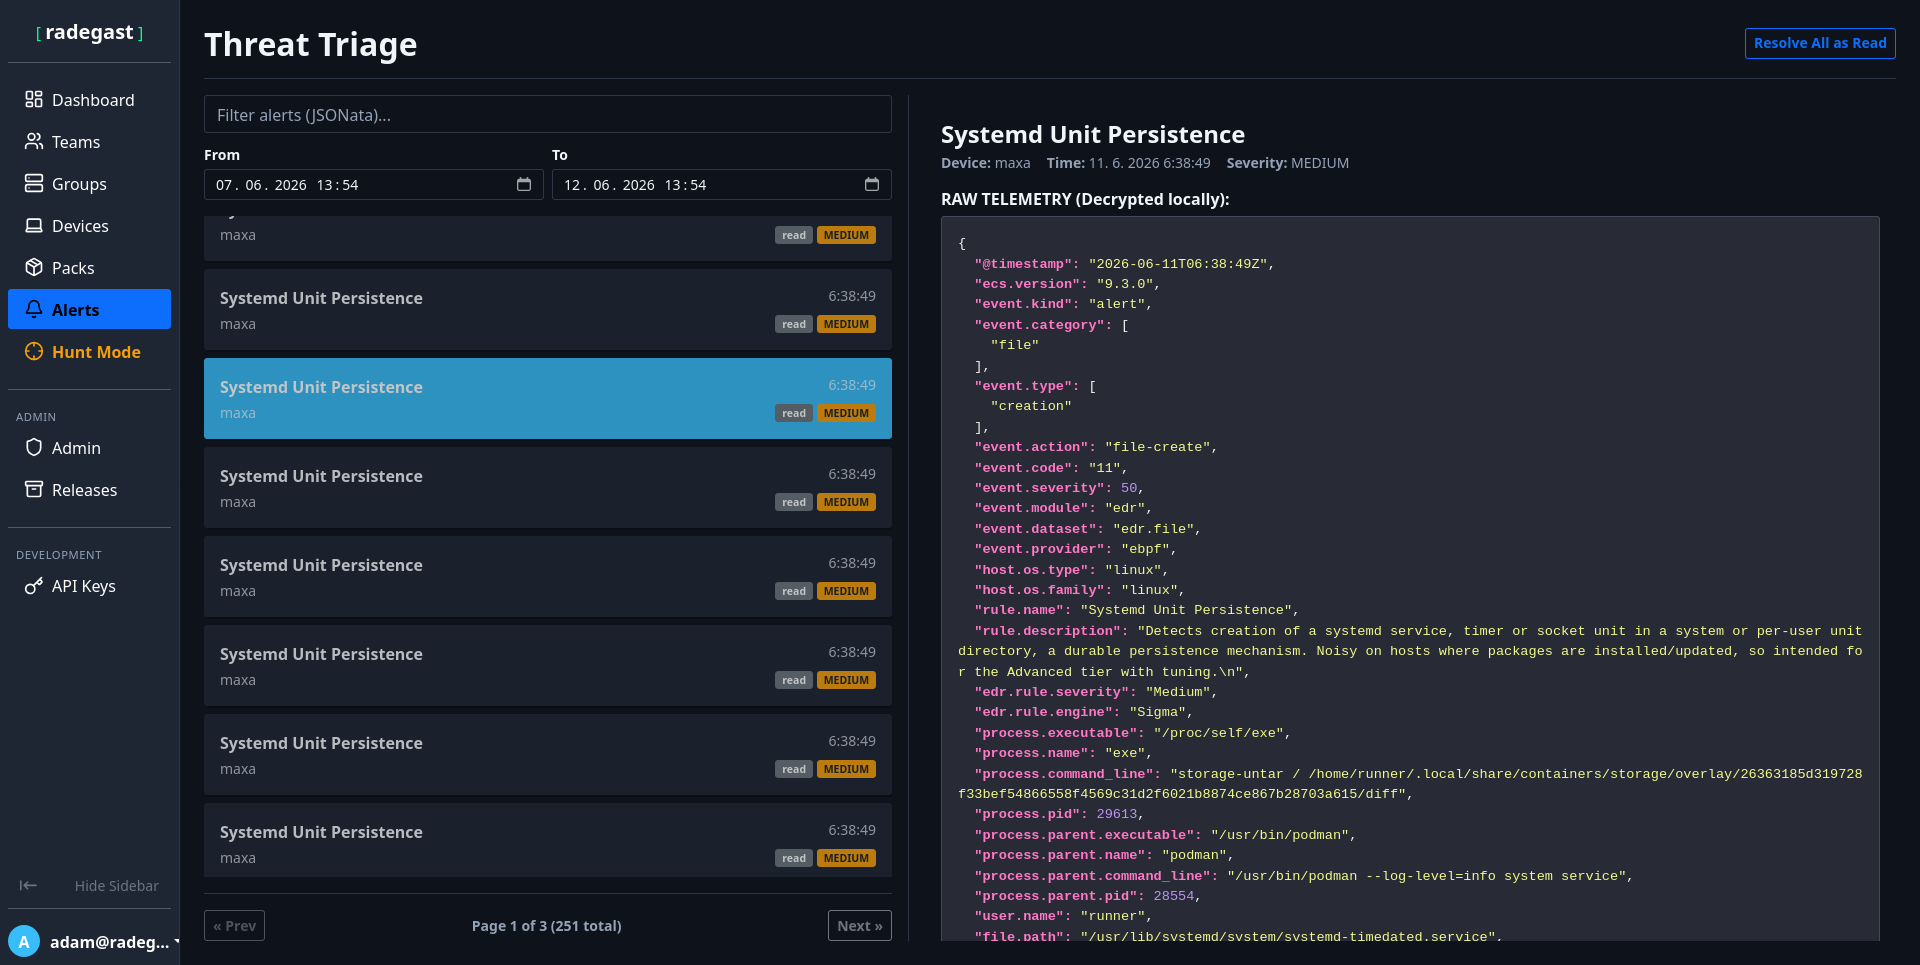
Alert
Alert's content is only decrypted within the browser using user's public key E2EE and shows the full data sent from the agent. If you find the alert to be a false-positive, you can create a new exclusion using JSONata.
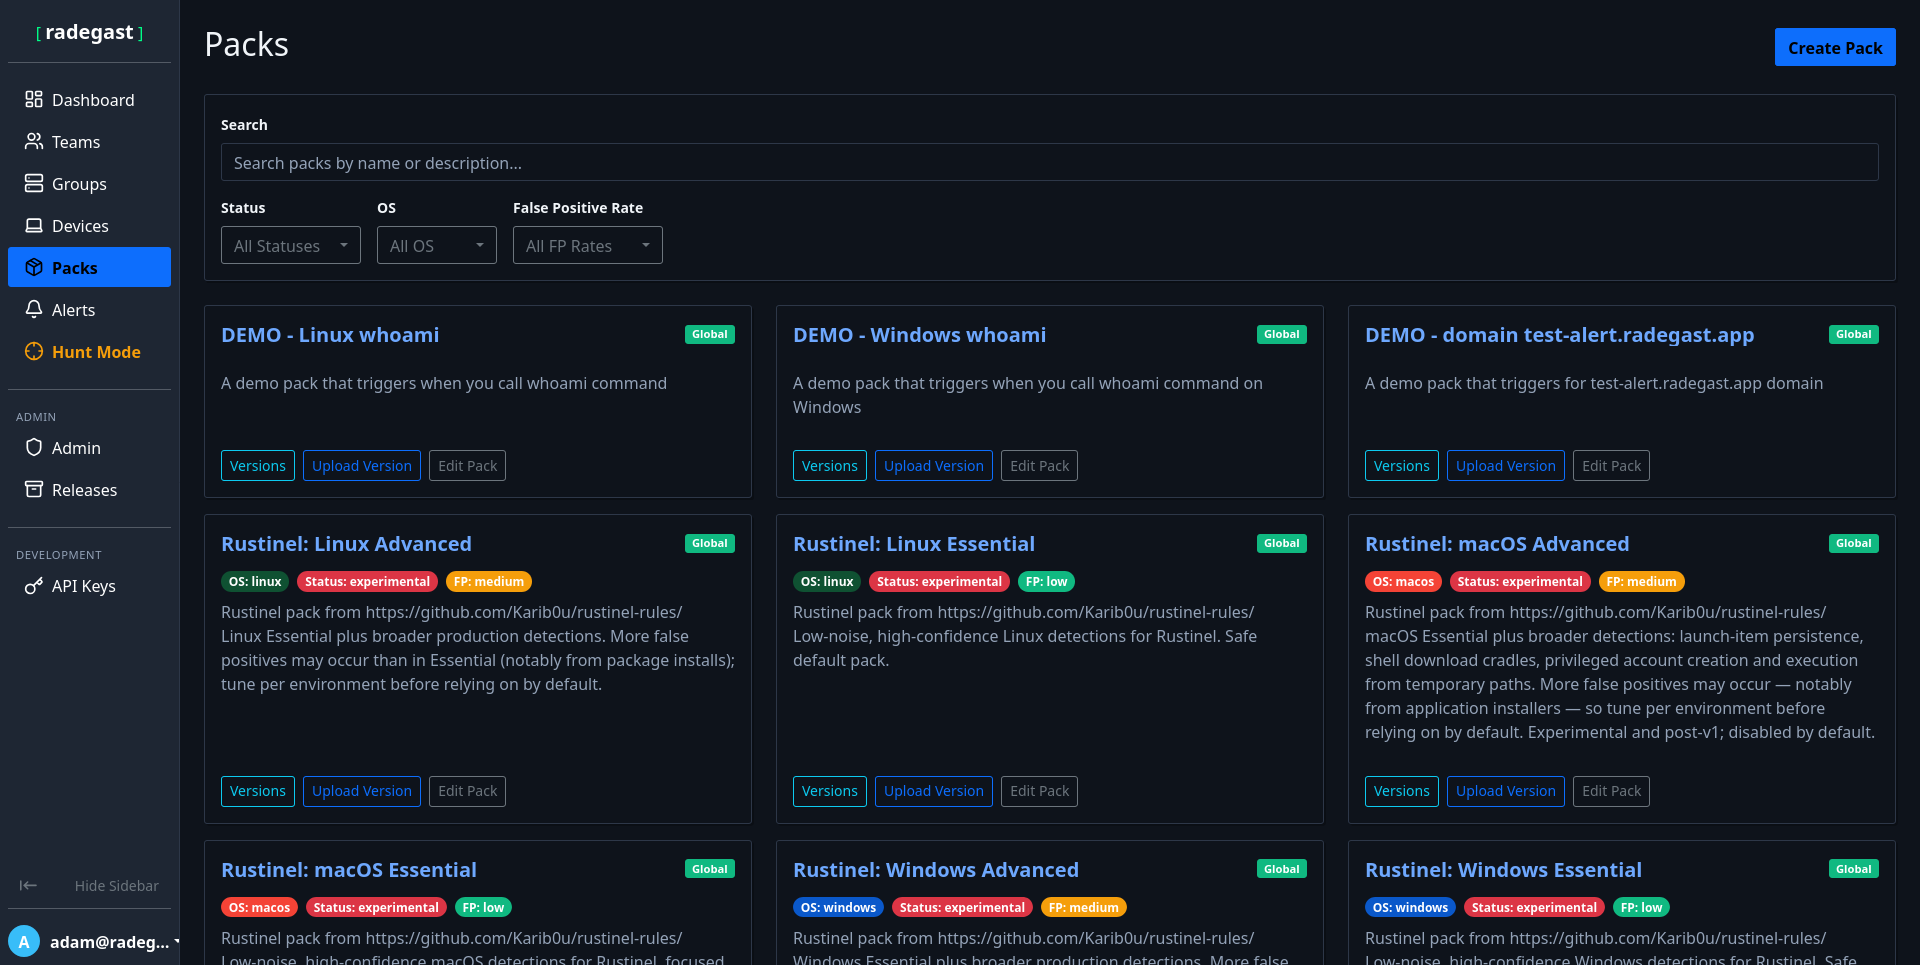
Packs
Your devices only detect what you tell them to do. You can select from a range of prepared packs that check for both common and novel attack patterns.